 Kernel Probe
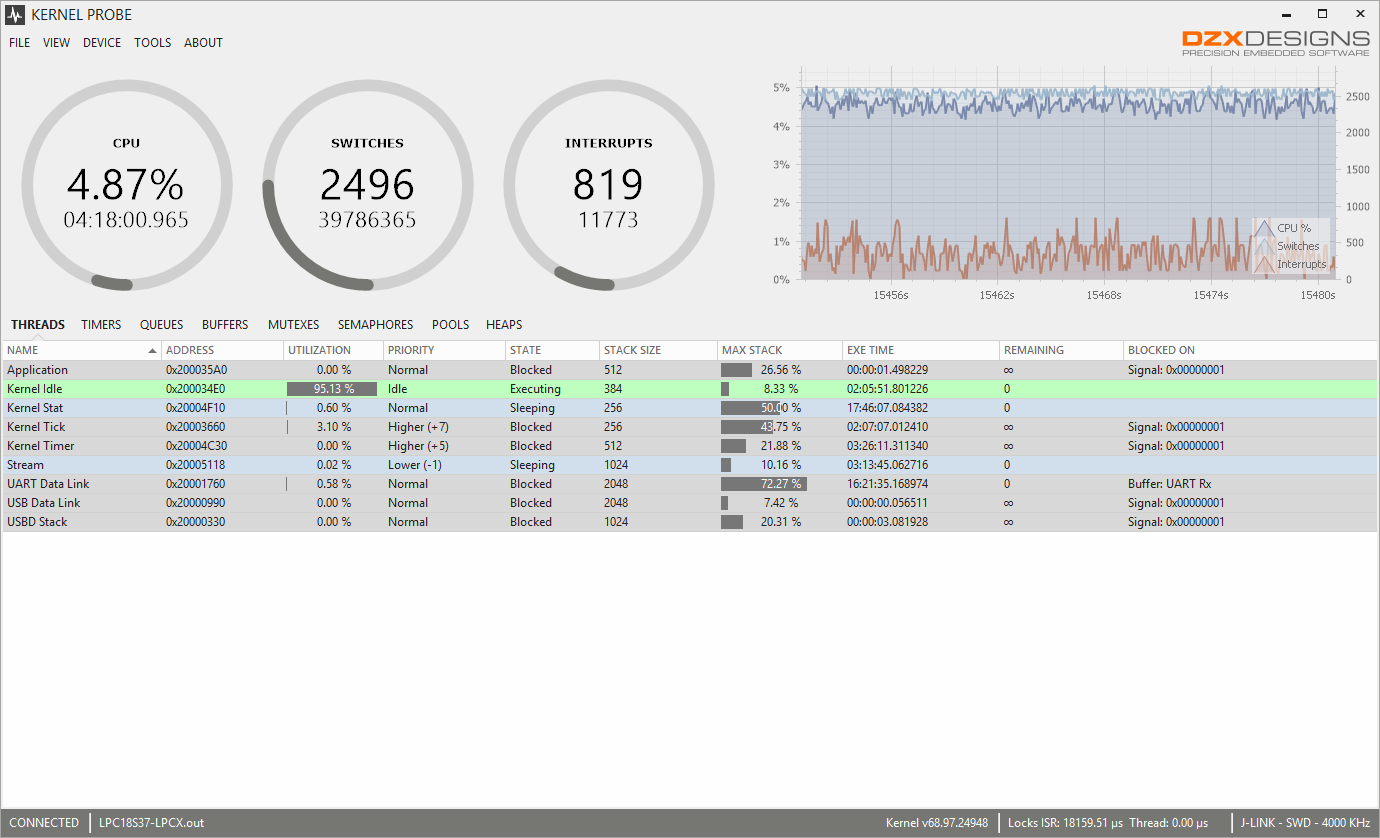
The Kernel Probe application provides a real-time display of the kernel while it is running within a device. The Kernel Probe application is part of
the Developer Tools download.
The application uses a connection with a JTAG/SWD interface debugger to acquire the information from the
target device. The application is useful for debugging as it gives a visual display for all of the kernel objects contained within the device.
Connecting to a Device
This topic contains information about how to connect to a target device using the Kernel Probe application. The Kernel Probe will
establish a connection with a debug interface which will then communicate to the target device.
From the main menu, select DEVICE -> Connect (or shortcut CTRL+D). The following dialog will be shown.
 | Loading… |
Use the 'EDIT SETTINGS' link to configure options for the debug interface.
The symbol file contains the debug information about the application that is running within the device. The symbol
file is created by the target IDE/toolchain (e.g. IAR Workbench, Keil uVision, Eclipse). Use the drop-down button to select a recently
used symbol file, or use the ellipsis button to browse and select the symbol file. Click 'Connect' to establish a connection.
Debugger Options
The debugger options can be configured within the application's options dialog. To open the options dialog, select
TOOLS -> Options from the main menu. Select 'Debugger' from the list on the left to display the debugger options.
The following options will be displayed.
| Loading… |
- Device
The device specifies the type of debugger to be used. Currently, only J-Link debuggers are supported.
- Driver
The driver that is to be used to communicate with the debugger. Use the ellipsis button to browse for the
driver file. The driver will be a .dll file. For a J-Link driver file, the file will be named jlinkarm.dll
and it can typically be found within most IDE/toolchain's installation directory.
- Interface
The physical interface that is used to communicate with the target microcontroller device.
- Clock
Select 'Auto' to automatically determine the clock rate, or select 'Manual' to use a fixed clock rate.
- Frequency
If 'Clock' is set to 'Auto', this specifies the initial clock frequency, otherwise, this is the fixed clock rate.
Display Values
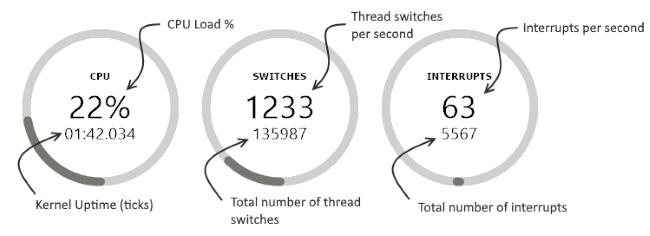
| CPU Load % |
Indicates the percent of time the CPU was executing a thread other than the idle thread. |
| Uptime |
Indicates the amount of time that the kernel has been running. |
| Switches per second |
Indicates the number of thread switches that are occurring each second. This is a good measure of how
much an application is switching what its doing versus actually doing work. |
| Total Switches |
Indicates the total number of thread switches that have occurred since the kernel was started. |
| Interrupts per second |
Indicates the number of interrupts that are occurring each second. This provides an indication of
the load placed upon the CPU by interrupts. |
| Total Interrupts |
Indicates the total number of interrupts that have occurred since the kernel was started. |
The bottom portion of the main display contains tabs that each display a list of kernel objects. The objects are only displayed after
they have been created within the kernel. For example, for a thread, it will only be displayed after the call to THREAD_Create(). The
following section describes each of the fields that are displayed for each type of kernel object.
Thread List View
| Name |
The name for the thread as specified when the thread was created |
| Address |
The address in device memory for the thread |
| Utilization |
The amount of CPU utilization that has been consumed by the thread |
| Stack |
The maximum amount of usage, in bytes and percent, of the stack memory for the thread (requires CFG_STACKFILLING in the device) |
| Priority |
The current priority level for the thread |
| State |
The current state of the thread.
| Stopped |
The thread exists within the kernel, but it is not alive (not started or has terminated) |
| Sleeping |
The thread is suspended from a call to THREAD_Sleep() |
| Blocked |
The thread is blocked waiting for an object or event to occur (see BLOCKED ON for details) |
| Ready |
The thread is ready to execute, but a different thread is currently being executed |
| Executing |
The thread is currently executing |
|
| Exe Time |
The total amount of time, in seconds, that the thread has executed |
| Remaining |
The amount of time, in kernel ticks, that the thread has remaining in it's current state |
| Blocked On |
The object or event, if any, that the thread is currently blocked waiting upon |
Timer List View
| Name |
The name for the timer as specified when the timer was created |
| Address |
The address in device memory for the timer |
| Type |
Indicates the type of the timer |
| State |
Indicates the current state of the timer (Stopped or Running) |
| Interval |
The current interval time, in kernel ticks, for the timer |
| Remaining |
The amount of time, in kernel ticks, remaining before the next expiration of the timer |
| Expired |
The amount of time, in kernel ticks, remaining before the next expiration of the timer |
Queue List View
| Name |
The name for the queue as specified when the queue was created |
| Address |
The address in device memory for the queue |
| Used % |
The amount of slots, in percent, that are currently used (not empty) |
| Max Used % |
The maximum amount of slots, in percent, that have ever been used (not empty) |
| Total |
The total number of items that have been through the queue |
| Capacity |
The maximum number of items the queue can contain |
| Blocked Threads |
The number of threads currently blocked by the queue |
Buffer List View
| Name |
The name for the buffer as specified when the buffer was created |
| Address |
The address in device memory for the buffer |
| Used % |
The amount of space, in percent, that currently contains data (not empty) |
| Max Used % |
The maximum amount of space, in percent, that has ever contained data (not empty) |
| Count |
The total number of data bytes currently contained within the buffer |
| Max Count |
The maximum number of data bytes that have ever been contained within the buffer |
| Total |
The total number of data bytes that have been through the buffer |
| Capacity |
The maximum number of data bytes that can be contained within the buffer |
| Blocked Threads |
The number of threads currently blocked by the buffer |
Mutex List View
| Name |
The name for the mutex as specified when the mutex was created |
| Address |
The address in device memory for the mutex |
| State |
The current state of the mutex (acquired or released) |
| Owner |
If currently acquired, the name of the thread that owns the mutex |
| Blocked Threads |
The number of threads currently blocked waiting to acquire the mutex |
Semaphore List View
| Name |
The name for the semaphore as specified when the semaphore was created |
| Address |
The address in device memory for the semaphore |
| Count |
The current count value for the semaphore |
| Max Count |
The maximum count value that is attainable for the semaphore |
| Blocked Threads |
The number of threads currently blocked waiting to acquire the semaphore |
Memory Pool List View
| Name |
The name for the memory pool as specified when the pool was created |
| Address |
The address in device memory for the memory pool |
| Used % |
The amount, in percent, of the blocks that have been allocated and are in-use (not empty) |
| Block Size |
The size, in bytes, of each of the blocks within the memory pool |
| Capacity |
The maximum amount of blocks that could ever be allocated from the memory pool |
| Blocked Threads |
The number of threads currently blocked waiting to allocate a block from the pool |
Memory Heap List View
| Name |
The name for the memory heap as specified when the heap was created |
| Address |
The address in device memory for the memory heap |
| Used % |
The amount, in percent, of the memory that has been allocated and is in-use (not empty) |
| Free Bytes |
The number of bytes of memory that is currently not allocated (free) |
| Free Blocks |
The number of blocks that represent the free memory for the heap (fragmentation) |
| Size |
The total size, in bytes, of the memory heap |